Report Builder Overview
| Platform: | WebMobile |
|---|---|
| Plan Type: | BasicEssentialPremiumEnterprise |
| User Type: | RequesterFull UserAdministrator |
Use Report Builder to create and share reports that help you analyze data across locations and organizations, and get visual and actionable insights.
You can create the following types of reports to visualize your data:
- Table
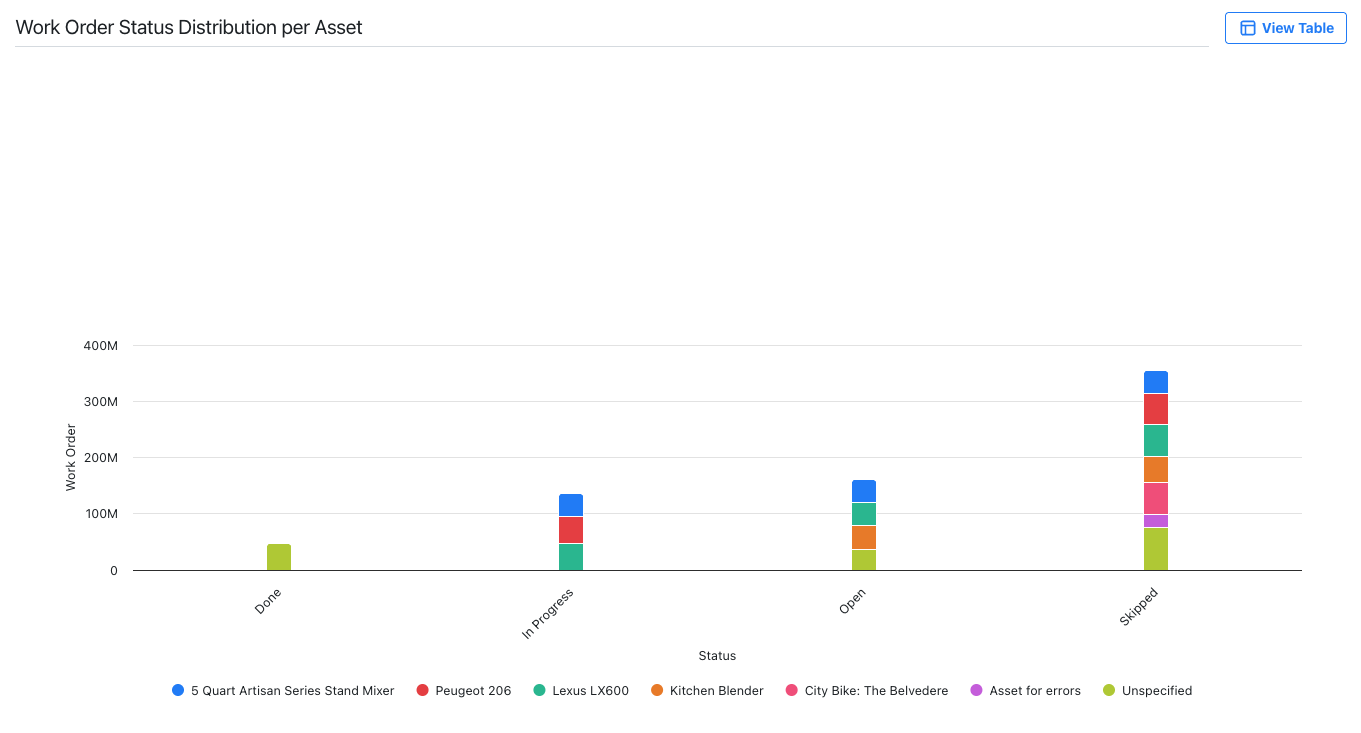
- Bar chart
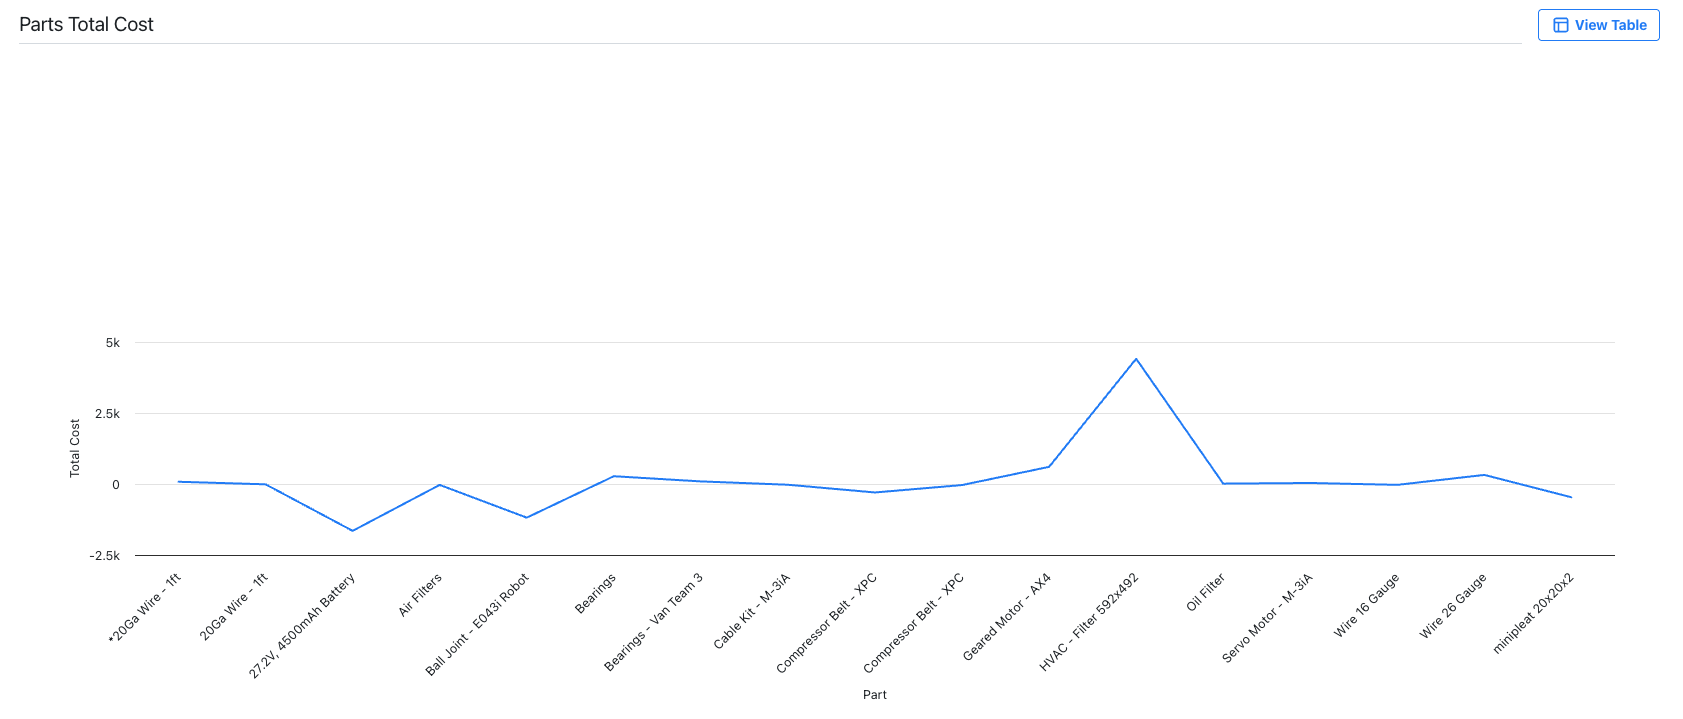
- Line chart
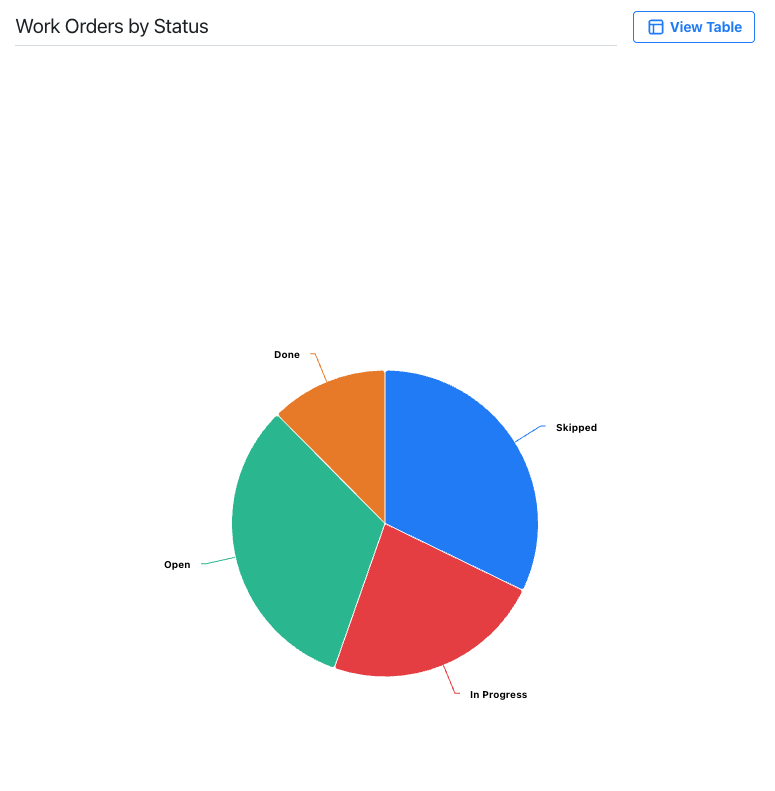
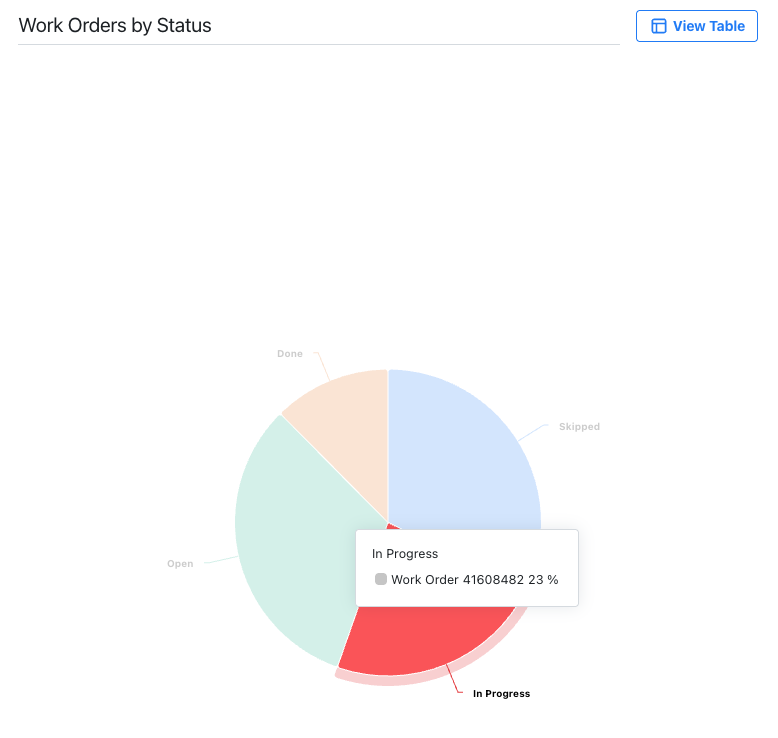
- Pie chart
The visualization type affects how MaintainX® presents the information and how you can share and use it in your organization.
Detailed Reporting vs. Visual Summary
Report Builder provides visualization types for both detailed reporting and visual summaries.
| Category | Visualization Type | Description |
|---|---|---|
| Detailed reporting | Table | Shows your raw data. |
| Visual summary |
| Represent your data graphically. |
Table Report
Use table reports to display detailed raw data with exact values. You can add as many columns as you want.

Graph Reports
Line Chart
Use line charts to see value progression and trends over time.

Bar Chart
Use bar charts to compare values.

Pie Chart
Use pie charts to see each part that makes up a whole.


Requirements and Considerations
After you select a visualization type, you need to tailor the report to focus on the data you want to analyze or share with your MaintainX organization. The available options depend on the visualization type you select.
| Visualization Type | Options |
|---|---|
| Table | Aggregation: Select an aggregation to refine the data in your report. |
| Graph: Bar, Line |
|
| Graph: Pie |
|
In the Report Builder, you can export your reports to a CSV or PDF file and distribute them to your stakeholders. For details, see Share a Custom Report. You can also add them to a MaintainX custom dashboard. For details, see Custom Dashboard.