About Reporting
This module is only available in the MaintainX® web application. Access to specific features depends on your MaintainX plan.
The Reporting module provides analytics features to help you understand your organization's operational data. You can use pre-built reports or build custom reports to analyze and share insights about your MaintainX organization.
You can use the Reporting module to:
- Track maintenance performance (MTTR, MTBF, on-time completion).
- Identify asset reliability issues and downtime.
- Understand labor usage, costs, and workload distribution.
- Share insights with stakeholders via dashboards and exports.
Reporting Walkthrough
Reporting is organized into tabs with specific options that give you access to a quick overview of your organization's performance and the tools you need to create more in-depth analysis.
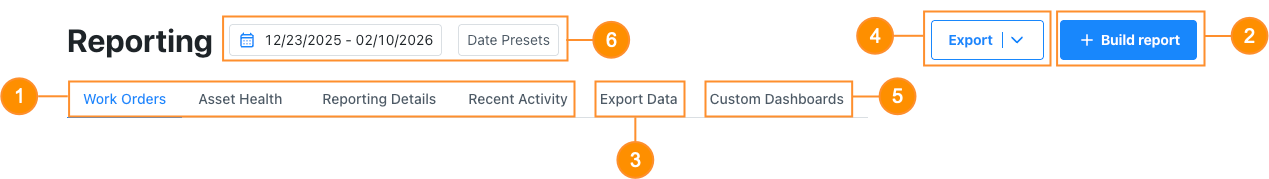
| Tab/Option | Description | |
|---|---|---|
| Standard Reports | 1 | Access MaintainX pre-built reports for Work Orders, Asset Health, etc. |
| Custom Reports | 2 | Build custom reports. |
| Exports | 3 | Export organization data. |
| 4 | Export a snapshot of all reports in a selected tab. This option is only available for Work Orders, Asset Health, Reporting Details, and Custom Dashboards. | |
| Custom Dashboards | 5 | Access custom dashboards. |
| Date Presets | 6 | Define the period shown in the pre-built reports. This option is only available for Work Orders, Asset Health, and Reporting Details. |
Standard Reports
Standard reports are MaintainX pre-built reports that give you predefined insights on specific data, such as work orders, assets, and user activities in your organization. You cannot edit these reports, but you can apply filters and adjust date ranges.
Work Orders and Asset Health reports provide summarized Key Performance Indicator (KPI) views. The Reporting Details tab lets you gain deeper insights into each report with advanced filtering and grouping.
Work Orders
MaintainX gives you access to different work order reports, each focusing on specific metrics. The Work Orders tab provides performance metrics related to work execution, including:
- Work order completion rates.
- MTTR (Mean Time to Repair) - average time to get an asset back online after a failure.
- MTBF (Mean Time Between Failures) - average time assets are operational before they need repair.
- On-time performance - percentage of work orders completed by due date.
- Labor hours and workload distribution.
For details, see About Work Order Reports.
Asset Health
The Asset Health tab gives you availability and reliability metrics based on asset status transitions (Online/Offline) to calculate:
- Downtime and performance trends.
- Availability - percentage of time an asset is operational.
- Reliability trends.
For details, see About Asset Health Report.
Reporting Details
The Reporting Details tab allows you to open each pre-built report individually and analyze them in detail. You can:
- Filter by team, priority, asset, or other criteria.
- Adjust groupings.
- Explore granular data behind visual summaries.
Recent Activity
The Recent Activity tab displays a log of all user activities in your organization, including:
- Completed work orders.
- Time logged in work orders.
- Status changes.
You can use this tab to audit operational activities.
Date Configuration
The Reporting module supports flexible date configuration to align analysis with operational cycles. You can define reporting periods for the Work Orders, Asset Health, and Reporting Details tabs.
To configure reporting periods, you can do one of the following:
Define a Date Range
You can select specific start and end dates or define a period to view your data.
- Select the (Calendar) field, and select any of the following options:
| Option | Description | Setting |
|---|---|---|
| Between | Reports on a defined start and end date. |
|
| Last | Reports on a relative period (e.g., last 30 days, last 5 weeks, last 2 months). |
|
| Group by | Group reported periods by days, weeks, or months. | Select the Group by option to group the reported period by Day, Week, or Month. |
For example, you could use:
- The Between option for month-end or quarterly reporting.
- The Last 30 days (Rolling) option for weekly operational reviews.
- The Group by Month option to share insights with your stakeholders.
Select Date Presets
- Select a predefined duration (days, weeks, months, or years) to determine how much data the report includes.
Custom Reports
Custom reports enable you to build your own reports, allowing you to combine and report on data within your organization.
Report Builder
Report Builder lets you build custom reports using data across your organization. Unlike standard reports, Report Builder allows you to use more data from your organization to:
- Select and combine datasets.
- Apply aggregations.
- Perform basic calculations.
- Choose a visualization to present your data.
You can build custom reports:
- From scratch by manually selecting data fields and a suitable visualization.
- By using a template with pre-selected data fields and a visualization.
- By prompting the MaintainX AI engine.
For details, see About Report Builder.
Export Options
You can export reporting data in the following ways:
Export Data
The Export Data tab allows you to export your organization's data to comma-separated values (CSV) files that you can open using any text editor or spreadsheet software, or import into other BI tools for further reporting and analysis. You can also export some data as PDF files. You can download your data exports in the Download Center.
For details, see About Data Exports.
Export Option
The Export option lets you export a current snapshot view of the Work Orders, Asset Health, Reporting Details, and Custom Dashboards tabs.
- Select the Export option, and select any of the following options:
| Option | Description | Setting |
|---|---|---|
| Export to PDF | Export a snapshot of the current report view. |
|
| Scheduled Export | Set recurring data exports. | Select the Scheduled Export option to create a scheduled data export. For details, see Create a Scheduled Data Export. MaintainX adds the scheduled data export to the Scheduled Exports table in the Download Center, where you can view and edit it. |
Download Center
Report snapshots and recurring data exports are automatically added to the Download Center. The Download Center lets you:
- Manage scheduled exports. For details, see View and Edit Scheduled Data Exports.
- Access and download all data exports in CSV or PDF formats.
To access the Download Center:
- From the sidebar, select Reporting.
- From the page header, select Export, then View Scheduled Exports. The Download Center opens.
Custom Dashboards
You can create custom dashboards to gain insight into your organization's performance.
Create custom dashboards to:
- Combine multiple reports into a unified view.
- Monitor KPIs in real time.
- Share performance views with stakeholders.
- Create executive-level reporting summaries.
Once created, custom dashboards appear in the Custom Dashboards tab.
For details, see About Custom Dashboards.
Which Reports Should You Use
MaintainX gives you access to multiple reporting features to surface your organization's operational data. Depending on your use cases, you can use the following reports to:
| Use case | Reporting Feature |
|---|---|
| Monitor maintenance KPIs. | Standard reports |
| Investigate asset reliability trends. | Asset Health |
| Build custom performance metrics. | Report Builder |
| Create an executive performance board. | Custom Dashboards |
| Export data in a CSV file and use it in a BI tool. | Export Data |
| Share recurring performance summaries. | Scheduled Export |