Global Reports and Dashboards
This feature is only available in the MaintainX® web application for Enterprise accounts. To use it, you must have a Global Leader user role and have a Global Organization. For more information on Global Organization, see About Global Organizations.
Global Reporting provides a centralized dashboard and reporting options that Global Leaders can use to access their sub-organizations' data from a Global Organization.
Global Leaders can:
- Get an overview of data related to their enterprise's sub-organizations. For details, see Overview Page.
- Set goals related to asset health and work orders for maintenance goals. For details, see Goals.
- Build global custom reports to analyze data across their sub-organizations. For details, see Build a Global Custom Report.
The Global Reporting dashboard lets you easily monitor and compare performance across your organizations. Through configurable reports located in the dashboard, you can:
- Get an overview of data related to the organizations you oversee. See Overview.
- Track key performance indicators (KPIs).
- Create custom dashboards
- Analyze site- or region-specific metrics
- Compare reports between organizations.
- Set asset health goals and work order goals for maintenance. See Goals.
Global Reporting capabilities allow you to make informed decisions about your organizations from a unified view.
Requirements
To use Global Reporting:
- Your enterprise must have a Global Organization with two or more sub-organizations. For details, see About Global Organizations.
- You must have a Global Leader user role.
Choose Dates for Dashboard Reports
To define the period represented in the reports, go to the overview page and set your date range or date presets.
Set a Date Range
The date range field specifies the reporting period. You can set specific dates or choose the number of days, weeks, months or years you want the reports to cover.
To set a date range:
Select the (Calendar) icon to select the date range you want.
Use Date Presets
Date presets are pre-configured date ranges that you add to the global reporting toolbar. For example, today’s date, yesterday's date, or the last month. After you add date presets to the toolbar, you can quickly switch between them without having to set the date range manually each time.
To add date preset:
-
From the reporting toolbar, do one of the following:
- If you don't have any active date presets, select Date Presets.
- If you do have active date presets, hover over them and then select the (Edit) icon.
The quick access dates list appears.
-
Select up to 3 quick access dates.
-
Click away from the quick access dates list.
-
Select one of the quick access date options you selected to update the date range.
You can only apply one date preset at a time.
Reporting Tabs
From the reporting tabs, you can access different reports, all of which can be filtered by organization, or other criteria. By default, the Overview page gives you an overview of the reports in the other tabs.
The available tabs are:
Overview Tab
The overview tab provides aggregated data about work orders, asset health in your organizations, and other information about your organizations.
You can select a specific date range, or use date presets to display data for a specific period. For details, see Choose Dates for Dashboard Reports.
The overview tab is a great place to quickly identify what works well and what needs more attention for the assets or work orders in your organizations.
For example, the Asset Health section shows the number of assets in your enterprise that are offline (unplanned). That data can help you make decisions about how to prepare and plan maintenance operations to bring those assets back online.
Asset Health Section
The Asset Health section on the Overview page shows your assets' health through their status, availability, and the mean time between failure (MTBF) and meant time to repair (MTTR).
-
Asset Status: Shows the number of Online, Offline (unplanned), and Offline (planned) assets across your organizations. For more information, see About Assets.
-
Availability Over Time: Shows the average asset availability during the date range as a percentage. For details, see Availability Over Time Report.
-
MTBF, MTTR:
- The Mean time between failures (MTBF) measures asset uptime. It tells you how long, on average, assets are operational before they need repair.
- The Mean time between repairs (MTTR) measures asset downtime. It tells you how long, on average, it takes your team to get an asset back online after a failure.
For more information, see MTBF vs MTTR.
Work Orders Section
The Work Orders section of the overview page shows how the organizations across your enterprise are performing as a whole when it comes to maintenance work. You can get this information by looking at the following charts:
- Created vs. Completed: Shows how many work orders your teams created and completed within the date range. For more information, see Created vs. Completed.
- On Time vs. Overdue: Shows how many work orders in the date range are past their due date, and how many are still on time. For more information, see On-Time vs. Overdue Report.
- Preventive vs. Reactive: Shows the number of work orders created in the date range that are Preventive, Reactive, or Other based on their Work Type field. For more information, see Work Order by Type Report.
Organizations Section
The Organizations section of the Overview page lists your organizations and displays information about them.
If you have maintenance goals and asset health goals set up, they are represented by different colors in the section. The colors represent the maintenance performance and asset health across the organizations in your enterprise. For more information, see Goals.
This section gives you a view in percentages of how your sub-organization is doing. You can add or remove the work order reports listed in the Work Orders section or the Asset Health section using the (Settings) icon.
To select work order reports:
In the Organizations section, select the (Settings) icon for more options.
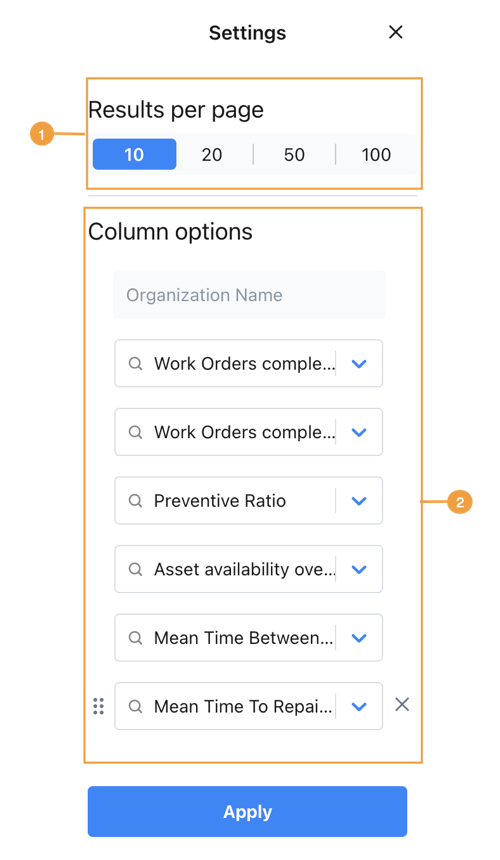
| Option | Description | |
|---|---|---|
| 1 | Results per page | The number of organizations to display. |
| 2 | Column options | Change the order of columns by dragging the (reorder) icon. Select the X icon to remove columns from the table. |
When you’re finished making changes, select Apply.
Work Orders Tab
The Work Orders tab provides access to work order reports for the organizations in your enterprise. You can view most of these reports together in this tab or open them individually on the Reporting Details tab, where you can group the work orders by different criteria, e.g., by organization.
For a list of work order reports, see About Work Order Reports.
Asset Health Tab
The Asset Health tab provides access to asset health reports. You can see how much planned and unplanned downtime your teams record for each asset or monitor asset availability in real-time for all the assets in your MaintainX organizations.
For a list of asset health reports, see About Asset Health Reports.
Reporting Details
The Reporting Details tab is where you can view the reports and open them individually. You can group and filter the data by different criteria, such as by organizations or by assignee.
Export Data
The Export Data tab allows you to export your MaintainX organizations’ data to comma-separated values (CSV) files that you can open using any text editor or spreadsheet software, or import into other products for further reporting and analysis.
For information, see About Data Exports.
Custom Dashboards
You can create custom dashboards to gain insight into improving performance across different areas of your enterprise's sub-organizations. Once created, your custom dashboards appear in the Custom Dashboards tab.
For more information, see About Custom Dashboards.
Goals
Goals are targets you set for Asset Health and maintenance metrics for your Global Organization. Goals show you at a glance how your sub-organizations are doing relative to those targets.
-
Asset Health Goals: Asset health goals are adjustable targets for the metrics shown in asset health reports. These targets help you understand how assets are performing across your sub-organizations. When asset health goals are on, you see additional information in asset health charts that show you at a glance how a sub-organization is doing relative to your targets. For more information, see Asset Health Goals.
-
Maintenance Goals: Maintenance goals are adjustable targets for metrics shown in work order reports. These targets help you assess work order performance like completed work orders or work orders completed on time. When maintenance goals are on, you get a visual indication of how a sub-organization is doing relative to the targets you set in the Overview page. For more information, see Maintenance Goals.
The goals you set in the Global Organization don't replace the goals that are set in individual MaintainX organizations in your enterprise.