Availability Over Time Report
| Platform: | AvailableWebNot availableMobile |
|---|---|
| Plan Type: | Not availableBasicNot availableEssentialNot availablePremiumAvailableEnterprise |
| User Type: | Not availableRequesterNot availableFull UserAvailableAdministrator |
The Availability Over Time report shows the average asset availability during the date range as a percentage. It uses the same availability calculation as the Asset Availability total in the Current Status section of the Asset Health tab, but can show availability data over a much longer range than 30 days.
MaintainX® calculates availability as:
Uptime / (Uptime + Downtime)
Uptime and downtime data come from changes to asset status.
Where to Find This Report
The Availability Over Time report appears on the Asset Health tab, and is available on the Reporting Details tab.
Report Source
The Availability Over Time report includes all assets, after any active filters are applied.
Charts
The Availability Over Time report includes the following charts.
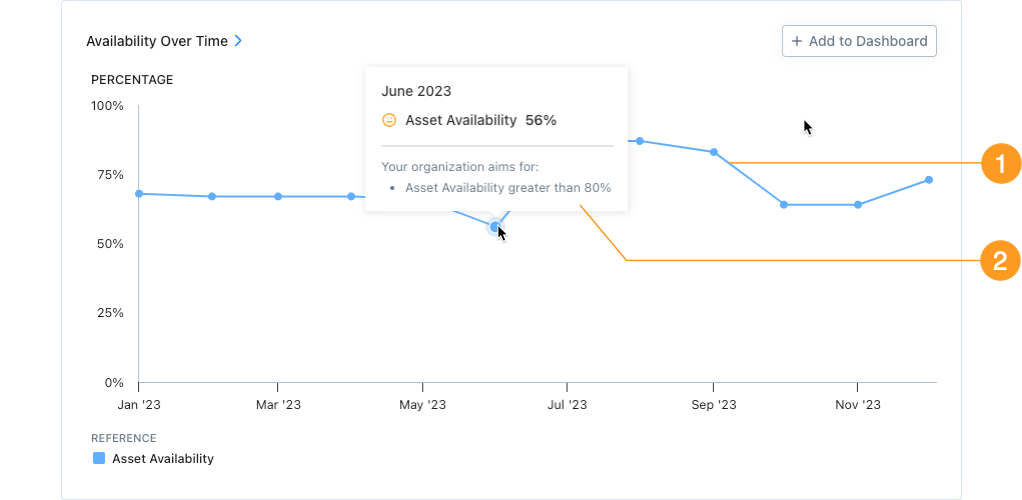
- The blue line/region 1 shows availability as a percentage for each reporting period (day, week, month, etc.) in the date range.
- Hover over any reporting period to display the following information:
-
The Availability percentage 2 for that period.
If asset health goals are on, the face icon (e.g., , , or ) tells you how the current percentage compares to your organization's goals (see Asset health Goals).
-
If asset health goals are on, your organization's goal for asset availability. You can change this in the Asset Health Goals settings.
-
How to Read This Report
Use the Availability Over Time report to track the percentage of time your assets are operational across a date range. The key metric to watch is the Availability percentage and whether it's trending up or down over time.
A declining availability rate may indicate that:
- Assets are failing more often.
- Downtime events are lasting longer.
- Planned maintenance is consuming more uptime than expected.
Because this report can cover a much longer date range than the current status view, it's useful for identifying long-term availability trends and evaluating whether your maintenance programs are improving asset uptime. Comparing periods before and after a maintenance program change can help you measure the program's impact.
In the Reporting Details tab, you can see Failures, Unplanned Downtime, and other key asset health data grouped by Asset, Location, and more.