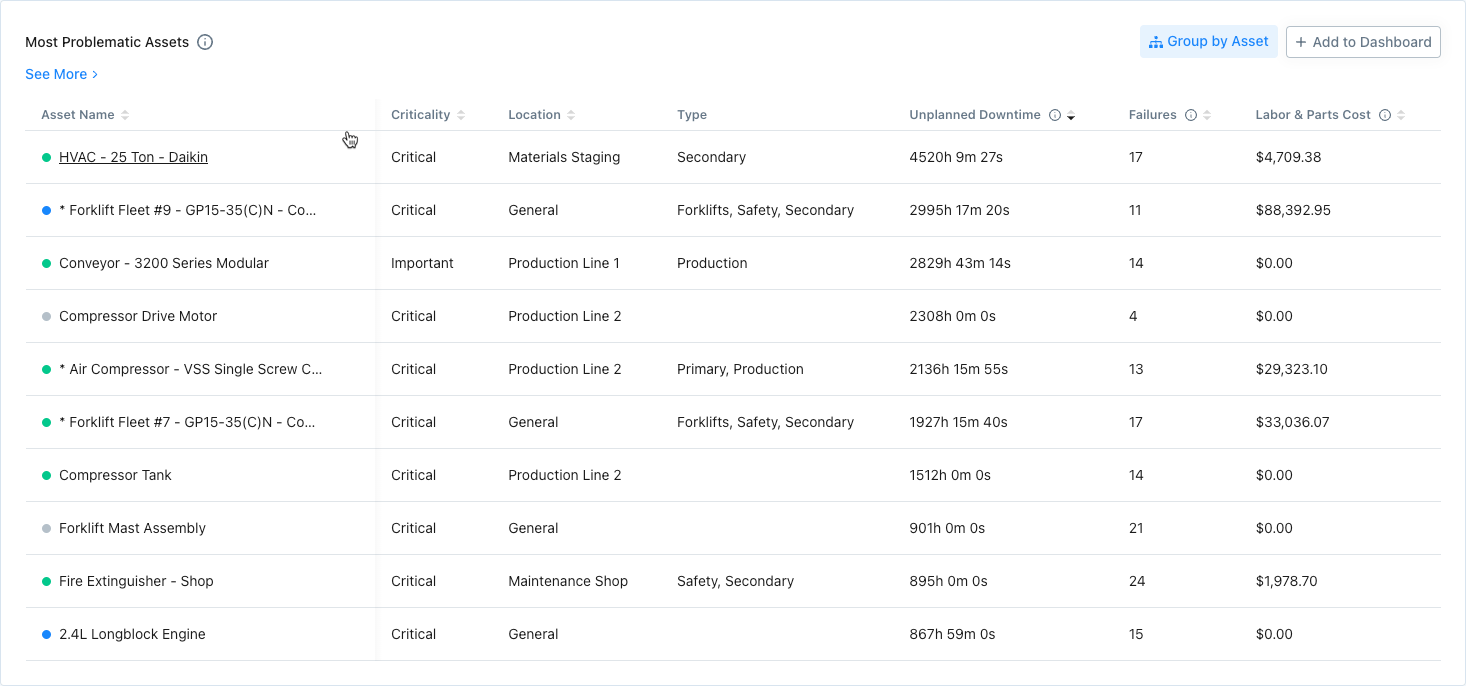
Most Problematic Assets Report
| Platform: | WebMobile |
|---|---|
| Plan Type: | BasicEssentialPremiumEnterprise |
| User Type: | RequesterFull UserAdministrator |
The Most Problematic Assets report shows a list of assets sorted by unplanned downtime. You can further sort them by characteristics like number of failures, associated costs, and criticality to access different insights.
This report helps identify the assets that fail most often, or cost the most to maintain. For highly problematic assets, you might need to use a different preventive maintenance strategy, or replace the assets altogether.
Where to Find This Report
The Most Problematic Assets report appears on the Asset Health tab.
Report Data

The data in this report comes from a variety of sources, including asset status changes, work orders, and the information stored for each asset. For each asset, you see the following information:
| Column | Description |
|---|---|
| Asset Name | The name that appears in the asset details. |
| Criticality | The importance assigned to each asset: either Critical, Important, or Normal. |
| Location | The Location assigned to each asset. |
| Type | The Asset Type assigned to each asset. |
| Unplanned Downtime | The number of hours each asset's status was Offline (unplanned) during the date range. |
| Failures | The number of times each asset's status was set to Offline (unplanned) during the date range. |
| Labor + Parts Cost | The total labor and parts costs added to work orders for each asset that were closed within the date range. |
Filter and Sort the Asset List
Use the standard filters for asset type, location, criticality etc. to control which assets the report shows. By default, it shows all your assets sorted by unplanned downtime hours.
Select the column heads to sort the list by name, criticality, location, number of failures, or associated labor and parts costs.
How to Read This Report
Use the Most Problematic Assets report to identify which assets are driving the most unplanned downtime and failures. The key metrics to watch are Unplanned Downtime and Failures.
Assets with high values in both columns are strong candidates for a revised preventive maintenance strategy or replacement. Availability provides important context; a low availability percentage signals that an asset is spending a significant portion of its time offline, which can have downstream impacts on operations.
An asset with high unplanned downtime and a Critical rating warrants more urgent attention than one rated Normal. Reviewing this report regularly can help you shift from reactive to proactive maintenance decisions.
In the Reporting Details tab, you can see Failures, Unplanned Downtime, and other key asset health data grouped by Asset, Location, and more.