Total Downtime Report
| Platform: | AvailableWebNot availableMobile |
|---|---|
| Plan Type: | Not availableBasicNot availableEssentialNot availablePremiumAvailableEnterprise |
| User Type: | Not availableRequesterNot availableFull UserAvailableAdministrator |
The Total Downtime report shows you how much downtime was reported for your assets in the date range. You can compare the number of planned downtime hours, unplanned downtime hours, and combined total downtime hours.
Where to Find This Report
The Total Downtime report appears on the Asset Health tab, and is available on the Reporting Details tab.
Report Source
The Total Downtime report includes all assets, after any active filters are applied.
Charts
The Total Downtime report includes the following charts.
-
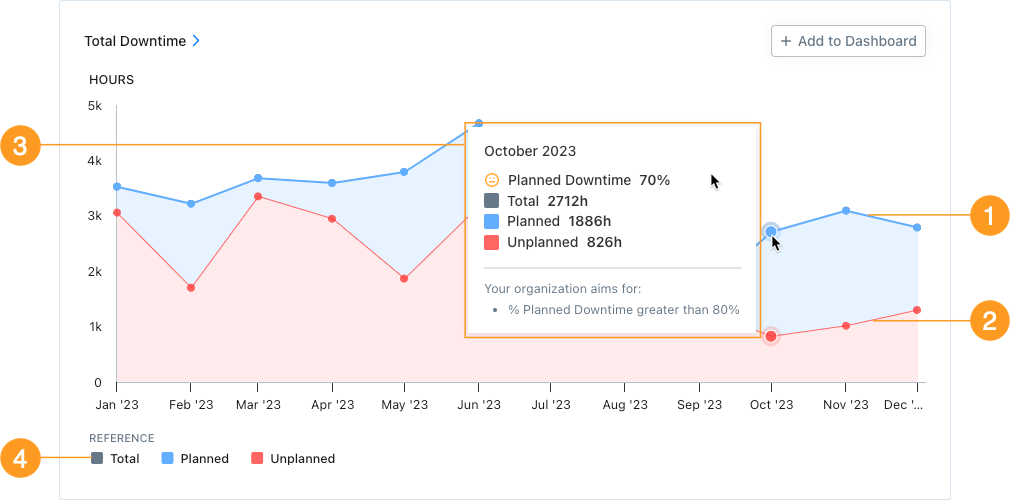
The blue line/region 1 shows planned downtime for each reporting period (day, week, month, etc.) in the date range.
-
The red line/region 2 shows unplanned downtime for each reporting period (day, week, month, etc.) in the date range.
-
The dark gray line/region (not pictured) shows the combined total downtime for each reporting period (day, week, month, etc.) in the date range.
-
Hover over any reporting period to display the following information 3 for that period.
-
The percentage of planned downtime.
If asset health goals are on, the face icon (e.g., , , or ) tells you how the current percentage compares to your organization's goals (see Asset health Goals).
-
The overall Total number of downtime hours.
-
The total number of Unplanned downtime hours
-
The total number of Planned downtime hours.
-
If asset health goals are on, your organization's goal for planned downtime. You can change this in the Asset Health Goals settings.
-
-
Hover over any item in the Reference section 4 to highlight its line in the chart, and dim the lines for the other items. For example hover over Total to dim the Planned and Unplanned lines.
How to Read This Report
Use the Total Downtime report to understand the overall scale of your asset downtime and how much of it is planned versus unplanned. The key thing to watch is the Unplanned downtime trend over time.
- Ideally, unplanned downtime should decrease as your preventive maintenance programs become more effective and assets fail less frequently.
- If unplanned hours are rising or consistently high relative to planned hours, it may signal that reactive maintenance is outpacing your team's ability to prevent failures.
- Comparing Planned, Unplanned, and Total downtime across periods can help you evaluate whether interventions are working and where to focus improvement efforts.
In the Reporting Details tab, you can see Failures, Unplanned Downtime, and other key asset health data grouped by Asset, Location, and more.