Unplanned vs. Planned Downtime Report
| Platform: | WebMobile |
|---|---|
| Plan Type: | BasicEssentialPremiumEnterprise |
| User Type: | RequesterFull UserAdministrator |
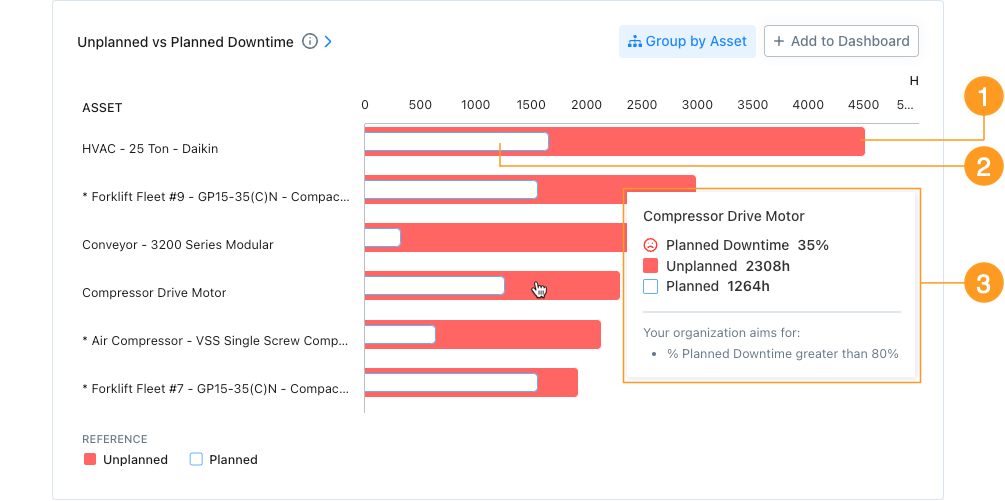
The Unplanned vs. Planned Downtime report sorts assets by number of downtime hours, and breaks down how many downtime hours were unplanned and planned. This report helps you to measure the effectiveness of your preventive maintenance program, and identify machines that might require more proactive work to keep online.
Where to Find This Report
The Unplanned vs. Planned Downtime report appears on the Asset Health tab, and is available on the Reporting Details tab.
Report Data
The data in this report is based on:
- The number of hours that each asset’s status is set to Offline.
- Whether downtime hours were marked as Planned or Unplanned when the asset's status changed.
Chart Details

-
Red bars 1 show you how many hours of Unplanned downtime your team recorded for each asset during the date range.
-
White bars 2 show how many hours of Planned downtime your team recorded for each asset during the date range.
-
Hover over any bar to display the following information 3 for a specific asset:
-
The percentage of planned downtime.
If asset health goals are on, the face icon (e.g., , , or ) tells you how the current percentage compares to your organization's goals (see Asset health Goals).
-
The total number of Unplanned downtime hours
-
The total number of Planned downtime hours.
-
If asset health goals are on, your organization's goal for planned downtime. You can change this in the Asset Health Goals settings.
-