About Asset Health Reports
| Platform: | WebMobile |
|---|---|
| Plan Type: | BasicEssentialPremiumEnterprise |
| User Type: | RequesterFull UserAdministrator |
Asset health reports use the data captured when your teams set assets' statuses to Online and Offline. They provide data-driven insights into asset reliability and availability.
Asset health reports can help you:
- Monitor asset availability in real time.
- Identify your most problematic assets and see the maintenance costs associated with them.
- See how much planned and unplanned downtime your teams record for each asset.
- Perform root cause analysis to learn more about why assets fail.
Use these insights to help you improve your preventive maintenance strategy, asset reliability, and budget decisions.
Where to Find Asset Health Reports
- From the sidebar, select Reporting to open the Reporting module.
- Go to the Asset Health tab.
List of MaintainX® Asset Health Reports
| Report | Description |
|---|---|
| Current Status | Shows you overall asset availability for the last 30 days as a percentage, and how many assets are currently online, offline for planned maintenance, and offline for unplanned maintenance. |
| Most Problematic Assets | Shows a list of assets sorted by unplanned downtime. |
| Unplanned vs. Planned Downtime | Sorts assets by number of downtime hours, and shows you how many downtime hours were unplanned and planned. |
| Unplanned Downtime Reasons | Shows the most common reported reasons for unplanned downtime, and allows you to see which assets had the most instances of unplanned downtime for each reason. |
| MTBF/MTTR | Shows mean time between failures (MTBF) and mean time to repair (MTTR), based on asset status changes. |
| Total Downtime | Shows how much planned, unplanned, and total downtime was reported for your assets. |
| Availability Over Time | Shows asset availability over time as a percentage. |
Asset Health Goals
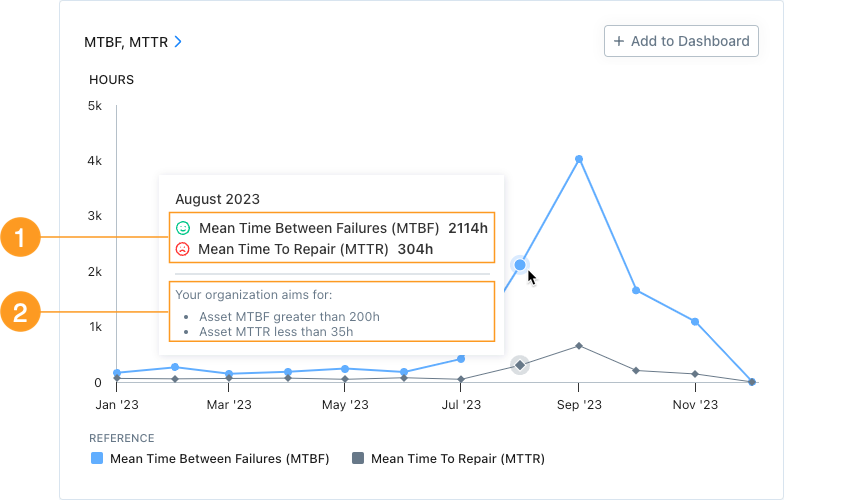
Asset health goals are adjustable targets for the metrics shown in asset health reports. When asset health goals are on, you see additional information in asset health charts that shows you at a glance how your organization is doing relative to the targets you set.

The face icons 1 tell you whether your current performance is Great, OK, or Bad compared to your organization's targets 2.
Turn Asset Health Goals On
- From the sidebar, open the Settings menu and select Features.
- On the Features tab, navigate to Reporting, and select Set Preferences.
- On the Reporting settings screen, navigate to Asset Health and toggle Asset Health Goals on.
- Set the ranges for your organization's asset health goals as needed. See Set Asset Health Goals.
Set Asset Health Goals
In the Reporting settings, you can set thresholds for Great, OK, and Bad performance for each asset health metric.

The type of value you set depends on the metric. For example, asset availability and planned downtime are percentages, while MTBF and MTTR are measures of time.
For some metrics (e.g., planned downtime), higher values are better, and the Great threshold must be higher than the Bad threshold. For other metrics (e.g., MTTR), you want lower values, and the Great threshold must be lower than the Bad threshold.
To set asset health goals:
-
From the sidebar, open the Settings menu and select Features.
-
On the Features tab, navigate to Reporting, and select Set Preferences.
-
On the Reporting settings screen, navigate to Asset Health and select Set Asset Health Goals.
noteYou might have to turn Asset Health Goals on to see the Set Asset Health Goals option.
-
On the Asset Health Goals screen, navigate to Set KPIs, and set the Great and Bad values as needed.
The range for OK values updates automatically to be between the thresholds for Great and Bad.
Your changes are saved whenever you leave the field for the value you're editing.