Work Orders by Type Report
| Platform: | AvailableWebNot availableMobile |
|---|---|
| Plan Type: | AvailableBasicAvailableEssentialAvailablePremiumAvailableEnterprise |
| User Type: | Not availableRequesterNot availableFull UserAvailableAdministrator |
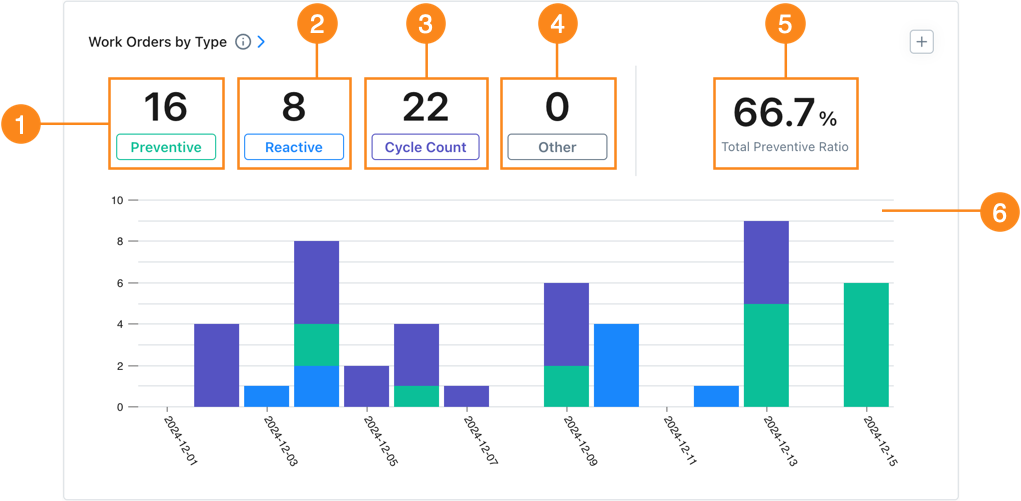
The Work Orders by Type report shows how many of the work orders created in the date range are Preventive, Reactive, Cycle Count or Other, based on their Work Type field.
It also shows the Total Preventive Ratio, which is the number of Preventive work orders divided by the total of Preventive and Reactive work orders (Cycle Count and Other work orders are not included in the calculation).
More preventive maintenance is associated with better asset availability and improved efficiency. A Total Preventive Ratio of about 80% is a good goal to aim for.
The target Total Preventive Ratio varies by industry. It’s normal to see more reactive work orders, and a lower Total Preventive Ratio, in industries with higher rates of reactive maintenance. For example, facilities management or hospitality.
Where to Find This Report
The Work Orders by Type report appears on the Work Orders tab, and is available on the Reporting Details tab.
Report Source
The Work Orders by Type report includes all work orders created within the date range, after any active filters are applied.
Data and Charts
The Work Orders by Type report includes the following data and charts.
Statistics
| Stat | Description | Action | |
|---|---|---|---|
| 1 | Preventive | Total number of work orders created within the date range that have Work Type set to Preventive. | Select the Preventive total to open a list of all preventive work orders included in the report. Select any work order to view its details. |
| 2 | Reactive | Total number of work orders created within the date range that have Work Type set to Reactive. | Select the Reactive total to open a list of reactive work orders included in the report. Select any work order to view its details. |
| 3 | Cycle Count | Total number of work orders created within the date range for cycle counts (See About Cycle Counts). | Select the Cycle Count total to open a list of cycle count work orders included in the report. Select any work order to view its details. |
| 4 | Other | Total number of work orders created within the date range that have Work Type set to Other. | Select the Other total to open a list of all work orders included in the report that have Work Type set to Other. Select any work order to view its details. |
| 5 | % Total Preventive Ratio | Total Preventive / Total (Preventive + Reactive) | None |
Charts
The stacked bar chart 6 shows the number of each type of work order in each reporting period (day, week, month, etc.) in the date range.
From top to bottom, each bar shows reactive, preventive, cycle count, and other work orders.
-
Hover over a segment of any bar to display the number of work orders of that type created in that period.
-
Select the segment to display a list of work orders of that type created in that period.
- Select any work order in the list to view its details.
How to Read This Report
Use the Work Orders by Type report to assess whether your team's maintenance work is balanced between reactive and preventive work. The key metric to watch is the ratio of Reactive work orders to Preventive ones.
- A high ratio of Reactive to Proactive work orders suggests assets are failing faster than your preventive program can get ahead of them, a potential sign that your preventive maintenance program could be strengthened.
- A healthy maintenance operation typically shows this ratio declining as teams become more proactive.
In the Reporting Details tab, you can see report results for Preventive and Reactive work orders grouped by Asset, Location, and more.
Organizations on an Enterprise plan have access to Asset Health reports, which provide a much more detailed view of asset status, and help identify problematic assets more accurately.
For more information about Asset Health reports, see About Asset Health Reports.