Non-Repeating vs. Repeating Report
| Platform: | AvailableWebNot availableMobile |
|---|---|
| Plan Type: | AvailableBasicAvailableEssentialAvailablePremiumAvailableEnterprise |
| User Type: | Not availableRequesterNot availableFull UserAvailableAdministrator |
The Non-Repeating vs. Repeating report shows how many of the work orders created in the date range are on a repeating schedule, and how many are one-time tasks.
Repeating work orders are associated with preventive maintenance, and related increases in efficiency. A Repeating Ratio of about 80% is a good goal to aim for.
The target Repeating Ratio varies by industry. It’s normal to see more non-repeating work orders and a lower Repeating Ratio in industries with higher rates of reactive maintenance. For example, facilities management or hospitality.
Where to Find This Report
The Non-Repeating vs. Repeating report appears on the Work Orders tab, and is available on the Reporting Details tab.
Report Source
The Non-Repeating vs. Repeating report includes all work orders created within the date range, after any active filters are applied.
Data and Charts
The Non-Repeating vs. Repeating report includes the following data and charts.
Statistics
| Stat | Description | Action | |
|---|---|---|---|
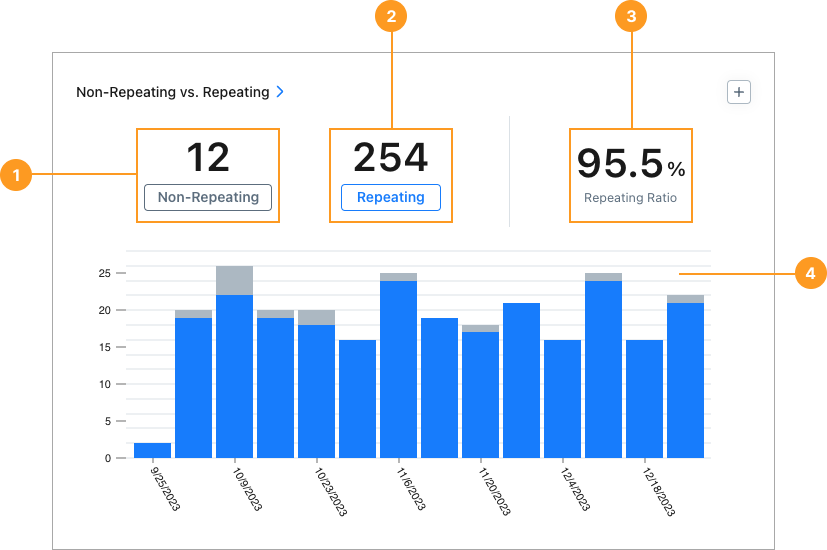
| 1 | Non-Repeating | Total Non-Repeating work orders created within the date range. | Select the Non-Repeating total to open a list of all non-repeating work orders included in the report. Select any work order to view its details. |
| 2 | Repeating | Total Repeating work orders created within the date range. A repeating work order is any work order that has a repeating schedule. Every repetition of the work order counts toward the total (see note below). | Select the Repeating total to open a list of repeating work orders included in the report. Select any work order to view its details. |
| 3 | % Repeating Ratio | Total Repeating / Total (Repeating + Non Repeating) | None |
The Repeating total includes every repetition of every repeating work order that occurs within the date range.
For example, if your date range is the last year, a work order that repeats weekly adds 52 work orders to the total. One for each repetition.
Charts
The stacked bar chart 4 shows the number of repeating and non-repeating work orders in each reporting period (day, week, month, etc.) in the date range.
The top part of each bar shows non-repeating work orders. The bottom part shows repeating work orders.
Hover over the top or bottom part of any bar to see the number of non-repeating or repeating work orders created in that specific period. Select the top or bottom part of any bar to display a list of non-repeating or repeating work orders for that specific period. Select any work order in the list to view its details.
How to Read This Report
Use the Non-Repeating vs. Repeating report to assess how much of your team's work is scheduled in advance versus handled on a one-off basis. The key metric to watch is the ratio of Repeating to Non-Repeating work orders.
- A high ratio of Repeating and Non-Repeating work orders generally indicates a more proactive maintenance operation.
- When the ratio is low, it may signal that your team is handling more unplanned, reactive work than expected.
In the Reporting Details tab, you can see report results for Repeating and Non-Repeating work orders grouped by Asset, Location, and more.
Organizations on an Enterprise plan have access to Asset Health reports, which provide a much more detailed view of asset status, and help identify problematic assets more accurately.
For more information about Asset Health reports, see About Asset Health Reports.