Time vs. Cost Report
| Platform: | WebMobile |
|---|---|
| Plan Type: | BasicEssentialPremiumEnterprise |
| User Type: | RequesterFull UserAdministrator |
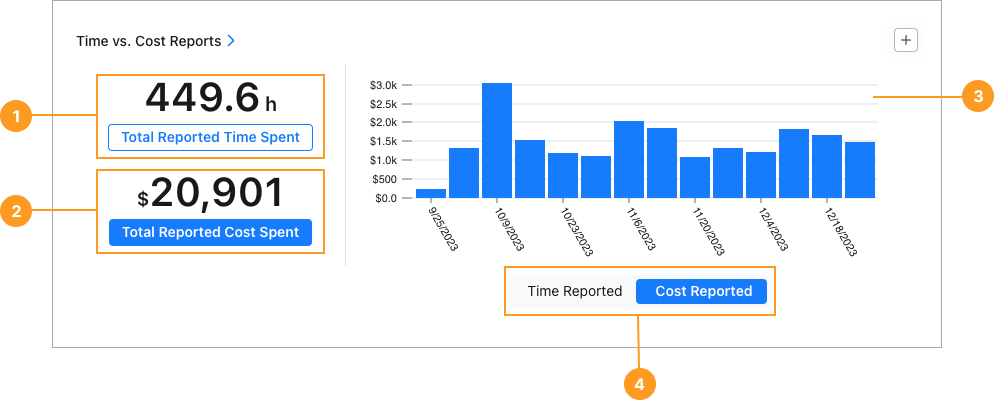
The Time vs. Cost report shows the total amount of time, and the total labor costs reported on completed work orders in the date range. It also shows breakdowns of time and cost according to the date range grouping (daily, weekly, monthly).
Where to Find This Report
The Time vs. Cost report appears on the Work Orders tab, and is available on the Reporting Details tab.
Report Source
The Time vs. Cost report includes all work orders completed within the date range, after any active filters are applied.
Data and Charts
The Time vs. Cost report includes the following data and charts.

Statistics
| Stat | Description | Action | |
|---|---|---|---|
| 1 | Total Reported Time Spent | The total number of hours reported in work orders included in the report. This includes any hours that work order assignees add in the Time & Cost Tracking > Time section. | Select the total to display a list of work orders included in the report. Select any work order in the list to view its details. |
| 2 | Total Reported Cost Spent | The total of all costs reported in work orders included in the report. This includes any costs that work order assignees add in the Time & Cost Tracking > Other Costs section. It does not include the cost for parts added to work orders. | Select the total to display a list of work orders included in the report. Select any work order in the list to view its details. |
Charts
The bar chart 3 shows a breakdown of reported time or reported cost for each reporting period (day, week, month, etc.) in the date range.
-
Select Time Reported or Cost Reported 4 to toggle the chart between time and cost.
-
Hover over any bar in the chart to see the total time or cost for that period.
-
Select any bar in the chart to display a list of work orders for that period.
- Select any work order in the list to view its details.
How to Read This Report
The Time vs. Cost report is useful for comparing the actual time and cost of labor to your budgeted time and cost. You can identify times when you were under, or over budget, and investigate further.
In the Reporting Details tab:
-
Group the results by Team or by Assignee to see which teams or individuals are on time and on budget.
-
Group the results by Asset to get an idea of each asset’s cost to repair.
This is useful when you have fleets or groups of the same asset. For example, you can look at a fleet of cars to identify the ones that cost the most to maintain. Those might be candidates for replacement.
tipAfter analyzing your assets in the Time vs. Cost report, you can follow up by exporting Part Transactions data to see how much problematic assets are costing in parts.
infoOrganizations on an Enterprise plan have access to Asset Health reports, which provide a much more detailed view of asset status, and help identify problematic assets more accurately.
Time vs. Cost Compared to Time to Complete
It’s important to understand the difference between this report and the Time to Complete report. This report captures only the hours that work order assignees log in work orders. The Time to Complete report captures the total amount of time from when you open a work order to when it’s closed.
For example, let’s say you need a work order to replace an HVAC filter.
- At 8:00 AM, you open the work order.
- At 4:15 PM, a technician performs the work and logs 30 minutes of time in the work order.
- At 5:00 PM, the technician marks the work order completed.
In that case:
- This report captures only the 30 minutes the technician logged in the work order.
- The Time to Complete report captures the nine hours between the time the work order was opened and the time the technician marked it complete.
For more information see Time To Complete Report.