On Time vs. Overdue Report
| Platform: | WebMobile |
|---|---|
| Plan Type: | BasicEssentialPremiumEnterprise |
| User Type: | RequesterFull UserAdministrator |
The On Time vs. Overdue report tells you how many work orders in the date range are past their due date, and how many are still on time.
Where to Find This Report
The On Time vs. Overdue report appears on the Work Orders tab, and is available on the Reporting Details tab.
Report Source
The On Time vs. Overdue report includes all work orders that have a due date within the date range, after any active filters are applied.
Data and Charts
The On Time vs. Overdue report includes the following data and charts.

Statistics
| Stat | Description | Action | |
|---|---|---|---|
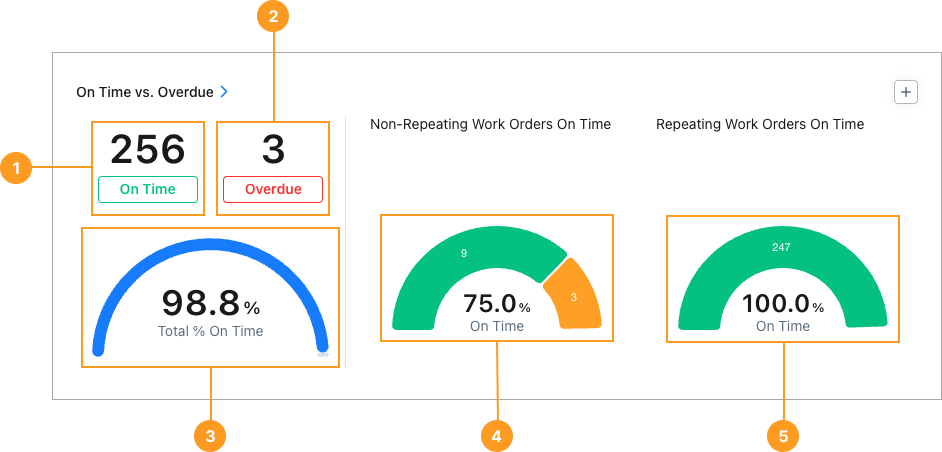
| 1 | On Time | The total number of work orders completed on or before their due date, and non-completed work orders whose due date has not passed. | Select the total to display a list of on time work orders. Select any work order in the list to view its details. |
| 2 | Overdue | The total number of work orders completed after their due date (Done Overdue), or whose due date has passed (Not Done Overdue). | Select the total to display a list of overdue work orders. Select any work order in the list to view its details. |
| 3 | Total % On Time | The percentage of work orders in the date range that were completed on time, or whose due date has not passed. | None |
Charts
The two half-donut charts 4, 5 show breakdowns of repeating and non-repeating work orders by overdue status:
| Overdue Status | Description |
|---|---|
| On Time | Date Completed is on or before the due date, or the due date has not passed. |
| Done Overdue | Status is Done. Date completed is after the due date. |
| Not Done Overdue | Any status except for Done. Due date has passed. |
-
Hover over any segment to display the number of work orders with that priority.
-
Select any segment to display a list of work orders with that priority.
- Select any work order in the list to view its details.
Each chart also displays the percentage of On Time work orders.
The chart area also displays the percentage of non-repeating work orders that don’t have a due date, provided that the date range and filters include any such work orders.
How to Read This Report
The On-Time vs. Overdue report graphs and totals give you a snapshot of your team’s efficiency or workload. If you see a high number of overdue work orders, use the Reporting Details tab to investigate further.
For example:
- Group work orders by Team or Assignee to see whether specific teams or individuals are responsible for more overdue work orders.
- Group work orders by Category to see whether specific types of work are more likely to be overdue.