Time to Complete Report
| Platform: | AvailableWebNot availableMobile |
|---|---|
| Plan Type: | AvailableBasicAvailableEssentialAvailablePremiumAvailableEnterprise |
| User Type: | Not availableRequesterNot availableFull UserAvailableAdministrator |
The Time to Complete report shows the following information:
- Total Hours: The total number of hours spent on the work orders in the date range. From the time they were opened to the time they were completed.
- AVG Hours: The average number of hours it took to complete a work order during the date range.
- MTTR AVG Hours: Mean time to repair (MTTR) is the average number of hours it took to complete a non-repeating work order.
- A breakdown of the average time in different statuses (Open, In Progress, On Hold), and MTTR for non-repeating work orders.
If your plan includes Asset Health reports, you can also use the MTBF-MTTR report, which calculates both mean time to repair and mean time between failures based on changes to asset status rather than work order types. For details, see MTBF-MTTR Report.
Where to Find This Report
The Time to Complete report appears on the Work Orders tab, and is available on the Reporting Details tab.
Report Source
The Time to Complete report includes all work orders created within the date range, after any active filters are applied.
Data and Charts
The Time to Complete report includes the following data and charts.
Statistics
| Stat | Description | Action | |
|---|---|---|---|
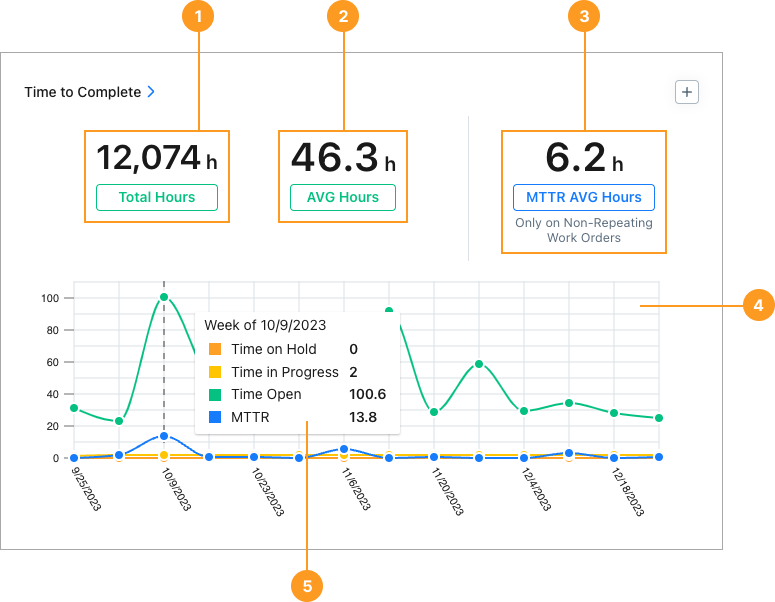
| 1 | Total Hours | The total number of hours spent on work orders in the date range. Calculated based on start date/date created and date completed. | Select the total to display a list of all work orders included in the report. Select any work order in the list to view its details. |
| 2 | AVG Hours | The average number of hours it took to complete a work order. This is the Total Hours / number of work orders. | Select the total to display a list of all work orders included in the report. Select any work order in the list to view its details. |
| 3 | MTTR AVG Hours | The average number of hours it took to complete a reactive work order. This is the Total Hours / number of non-repeating work orders. | Select the total to display a list of reactive work orders included in the report. Select any work order in the list to view its details. |
Charts
The line chart 4 shows the following information for each reporting period (day, week, month, etc.) in the date range
- Time in status: The average number of hours that a work order in the reporting period was Open, In Progress, or On Hold.
- MTTR: The average number of hours it took to complete a reactive work order in the reporting period.
Hover over any reporting period to display the time-in-status and MTTR numbers for that specific period 5.
-
Select any period in the chart to display a list of non-repeating work orders included in the MTTR calculation for that specific period.
- Select any work order in the list to view its details.
How to Read This Report
Use the Time to Complete report to understand how long it takes your team to move work orders from open to done. The key stats to watch are AVG Hours and MTTR AVG Hours.
- A rising average may signal bottlenecks, resource constraints, or work orders sitting idle in Open or On Hold status. The time-in-status breakdown in the chart can help you pinpoint where time is being lost.
- MTTR is particularly useful for evaluating your team's responsiveness to reactive, unplanned work.
In the Reporting Details tab, you can see Members, Total Hours, AVG Hours, MTTR AVG Hours, and time-in-status data (Open Hours, Open AVG Hours, In Progress Hours, In Progress AVG Hours, and On Hold Hours) for work orders grouped by Asset, Location, and more.
Time to Complete Compared to Time vs. Cost
It’s important to understand the difference between this report and the Time to Complete report. This report captures only the hours logged using the Time & Cost Tracking feature in work orders. The Time to Complete report captures the total amount of time from when you open a work order to when it’s closed.
For more information, see Time and Cost Tracking.
For example, let’s say you need a work order to replace an HVAC filter.
- At 8:00 AM, you open the work order.
- At 4:15 PM, a technician performs the work and logs 30 minutes of time in the work order.
- At 5:00 PM, the technician marks the work order completed.
In that case:
- This report captures the 8 hours between the time the work order was opened and the time the technician marked it complete.
- The Time vs. Cost Report captures only the 30 minutes the technician logged in the work order.
For more information see Time vs. Cost Report.