Report Builder Walkthrough
| Platform: | AvailableWebNot availableMobile |
|---|---|
| Plan Type: | Not availableBasicNot availableEssentialNot availablePremiumAvailableEnterprise |
| User Type: | Not availableRequesterNot availableFull UserAvailableAdministrator |
Use Report Builder to build custom reports using data from your MaintainX® organization, like work orders, assets, part inventories, and more. Report Builder's flexible configuration options help you analyze performance, uncover trends, and deliver meaningful insights to stakeholders. You can enhance your custom reports with different visualization types, like pie charts, bar graphs, and line graphs.
Report Builder offers multiple ways to build a report. Start from scratch for full control and customization, or select a pre-built template for a quick setup. These flexible options help you:
- Save time by using available templates for frequent reporting needs.
- Control every detail when you need a customized view of your operations.
- Quickly share insights with your stakeholders.
Report Builder Layout
Before building your first custom report, take a moment to get familiar with the Report Builder layout and key components.
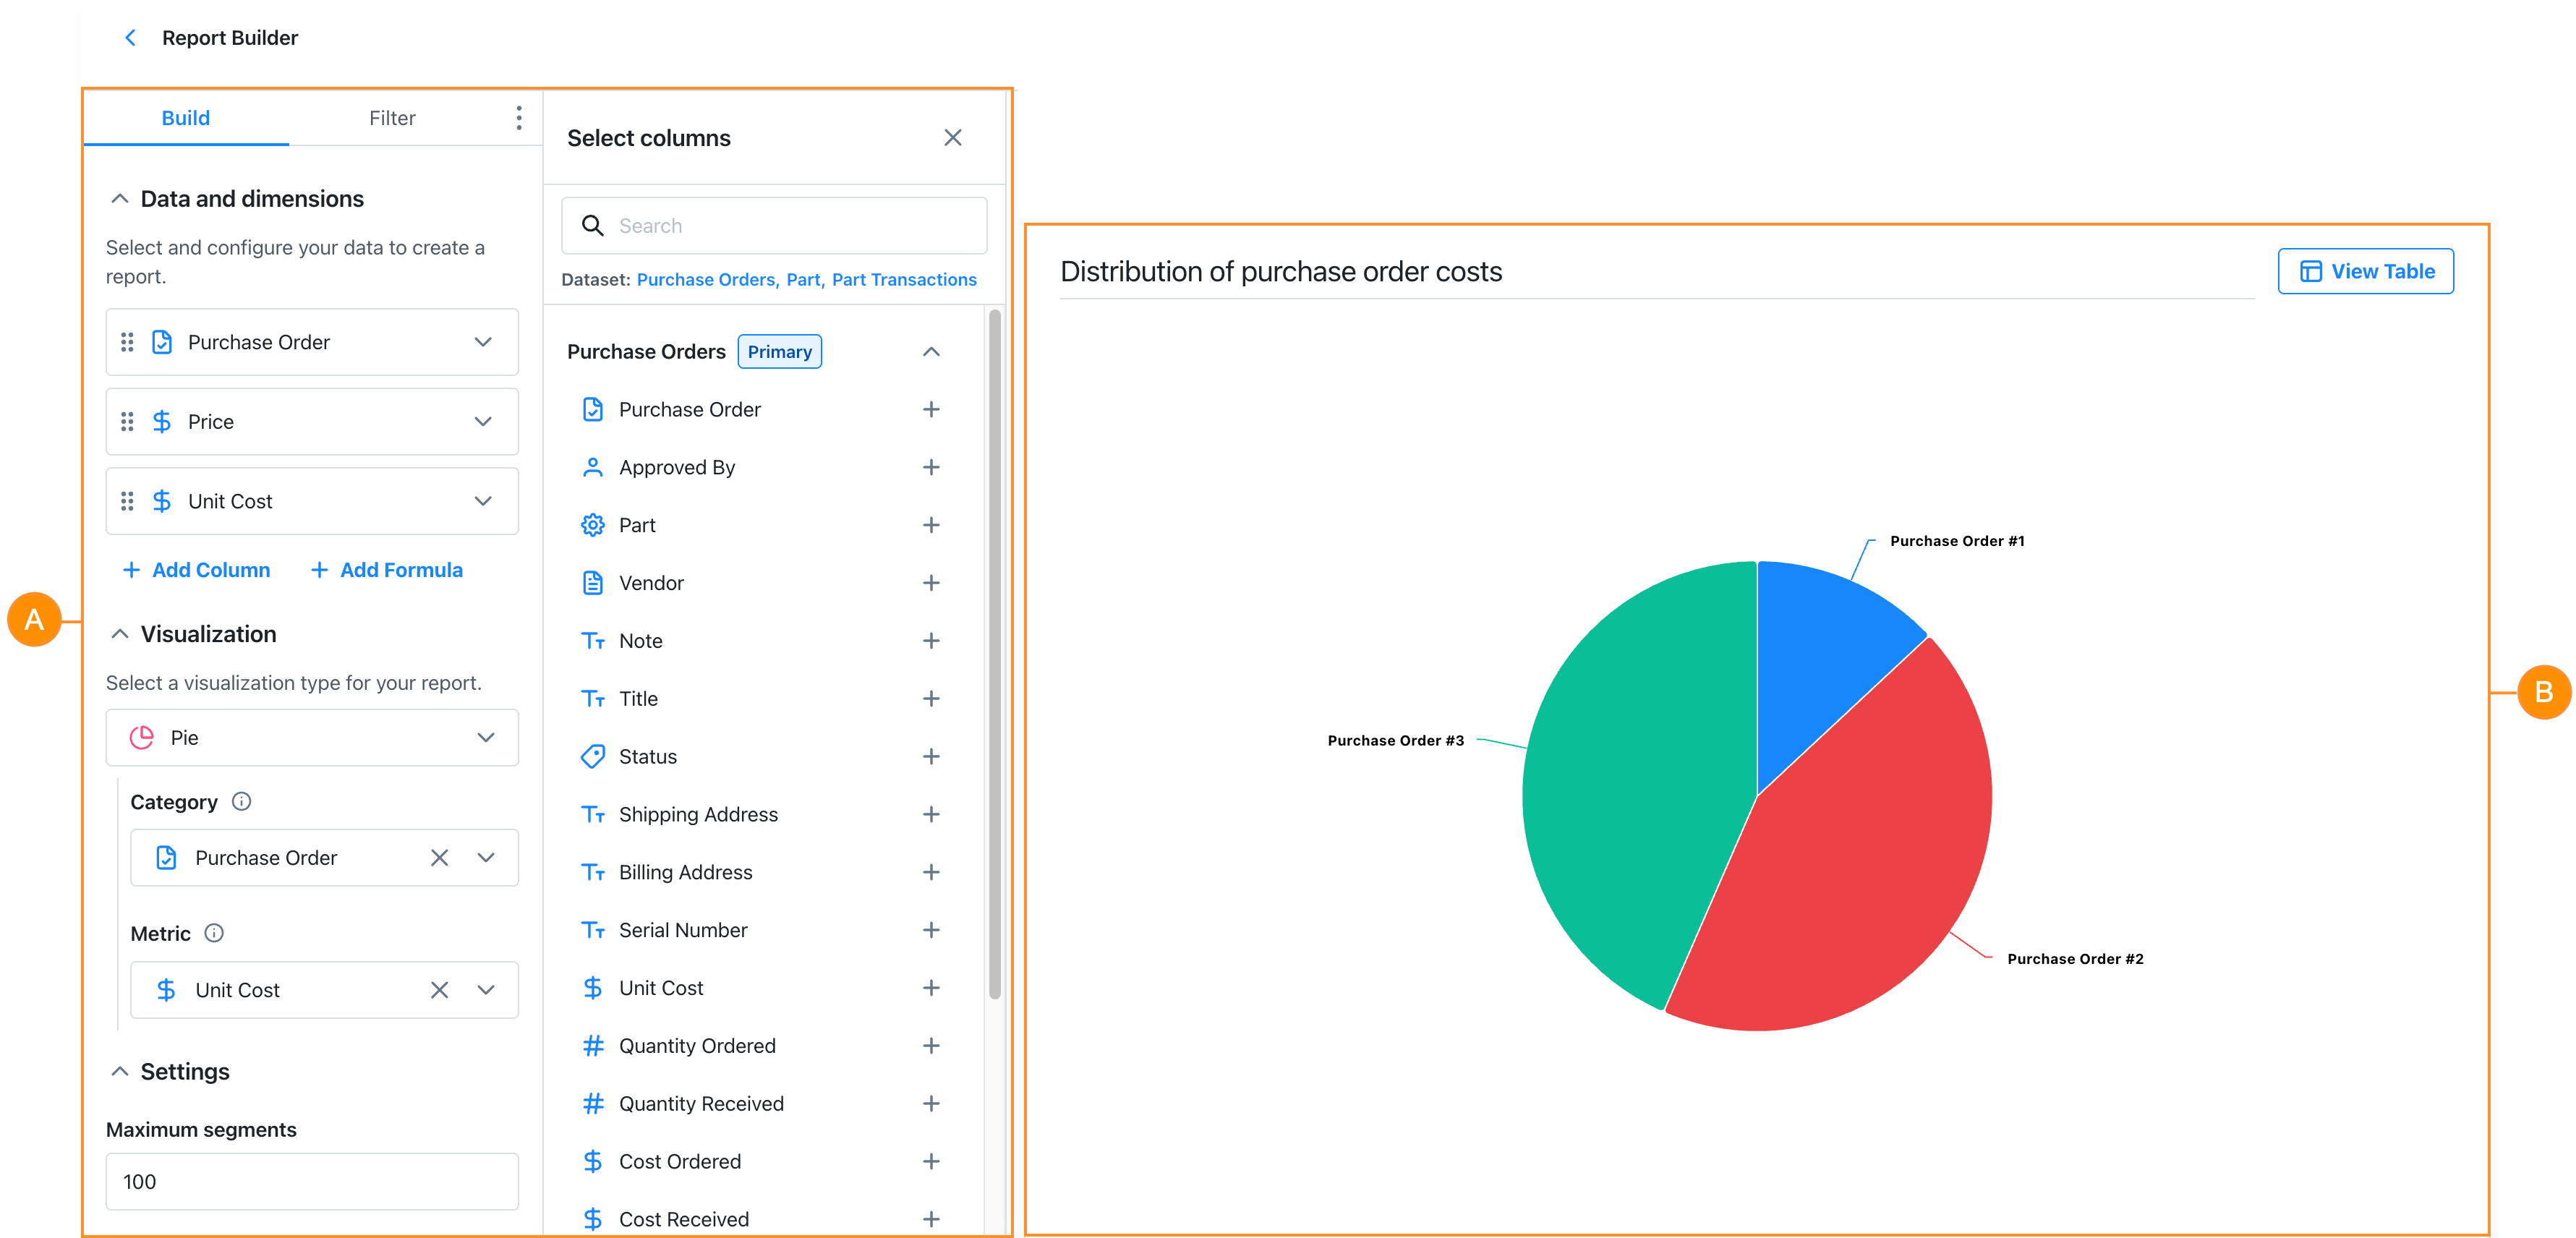
The Report Builder is divided into two panels:
- The Builder panel A, where you build and edit custom reports
- The Preview panel B, where you see how your custom reports look as you build them.
Each panel gives you access to different settings.
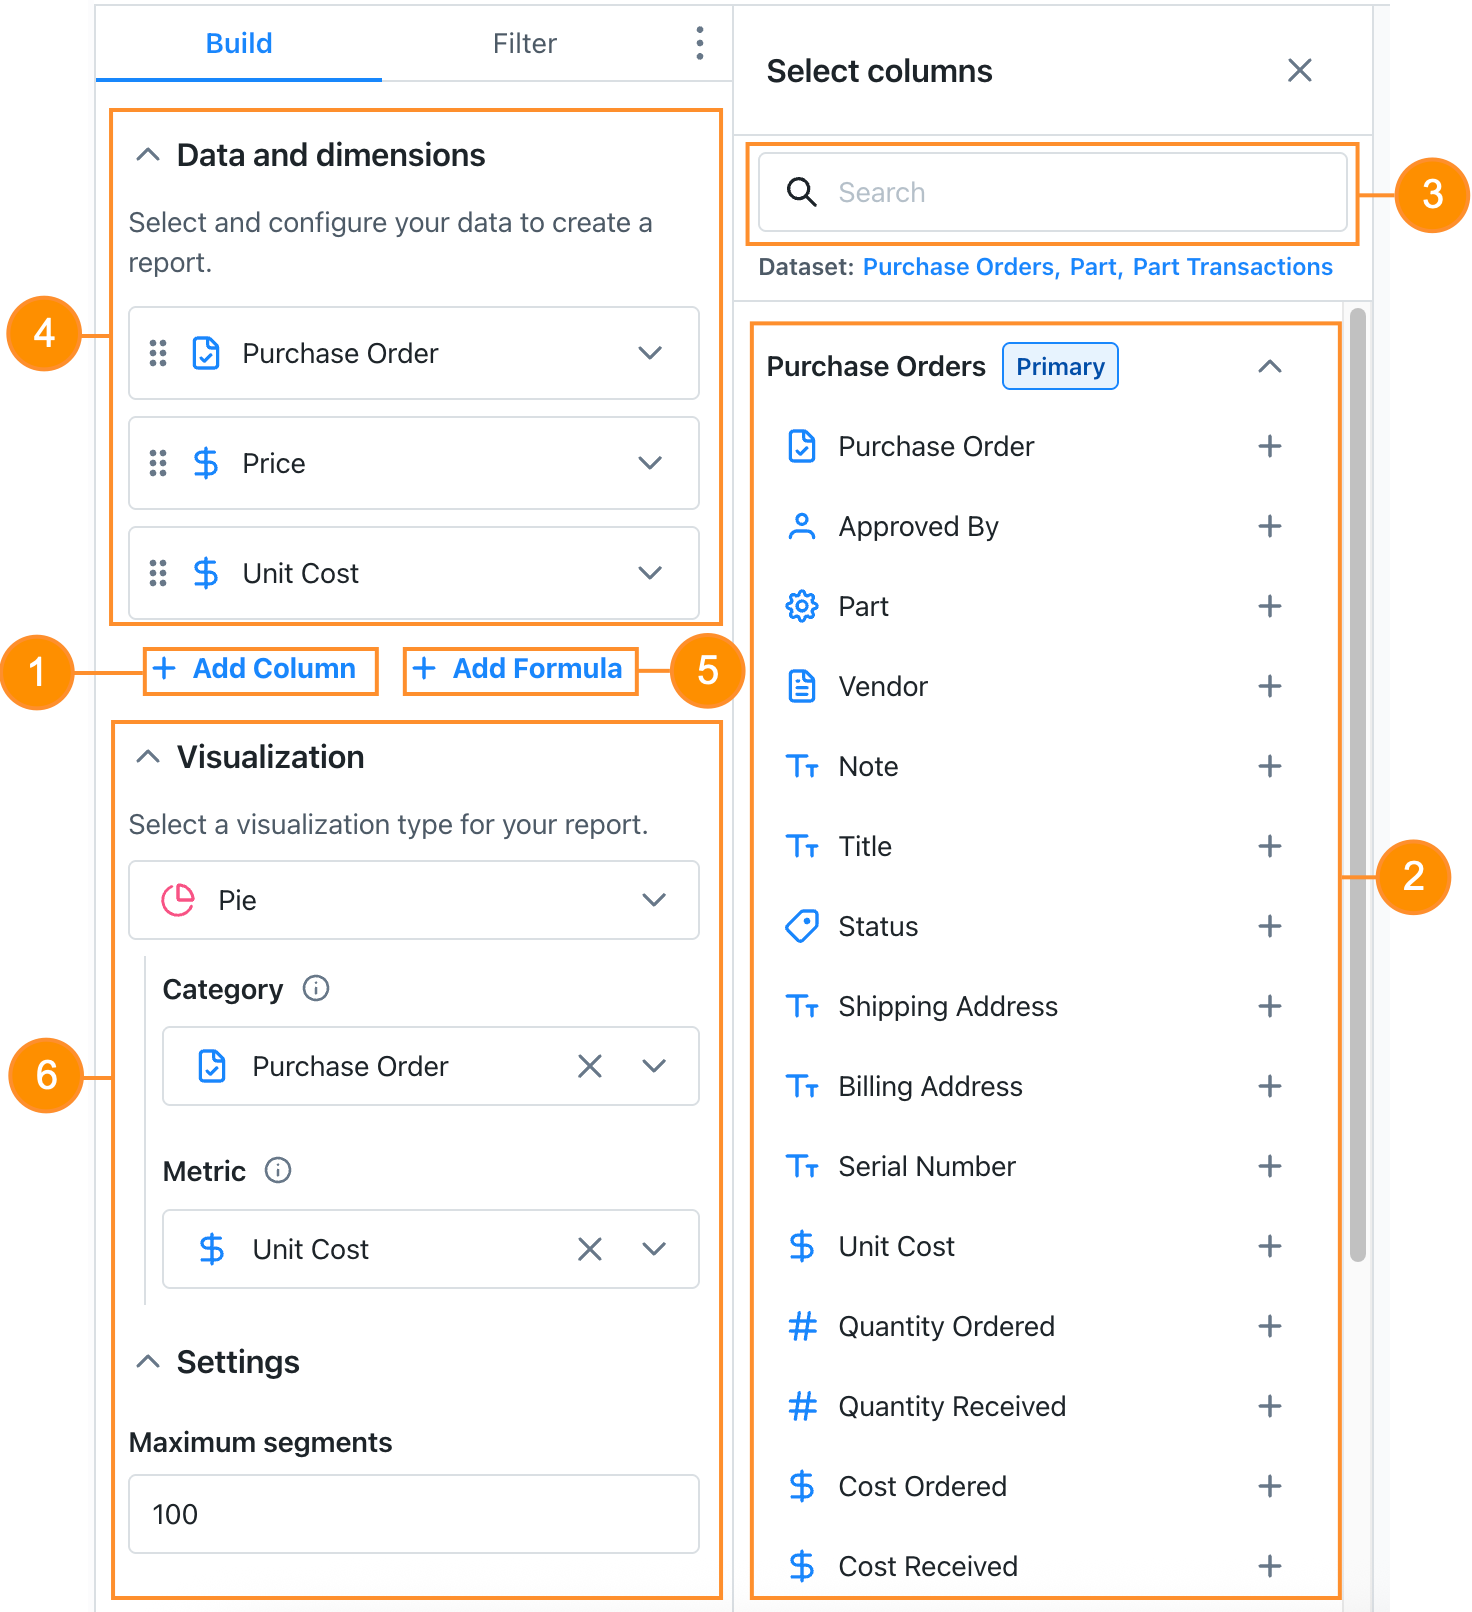
Builder Panel
The builder panel consists of two tabs for building and configuring your report:
- The Build tab provides access to a list of columns associated with a selection of datasets. For details, see Datasets.
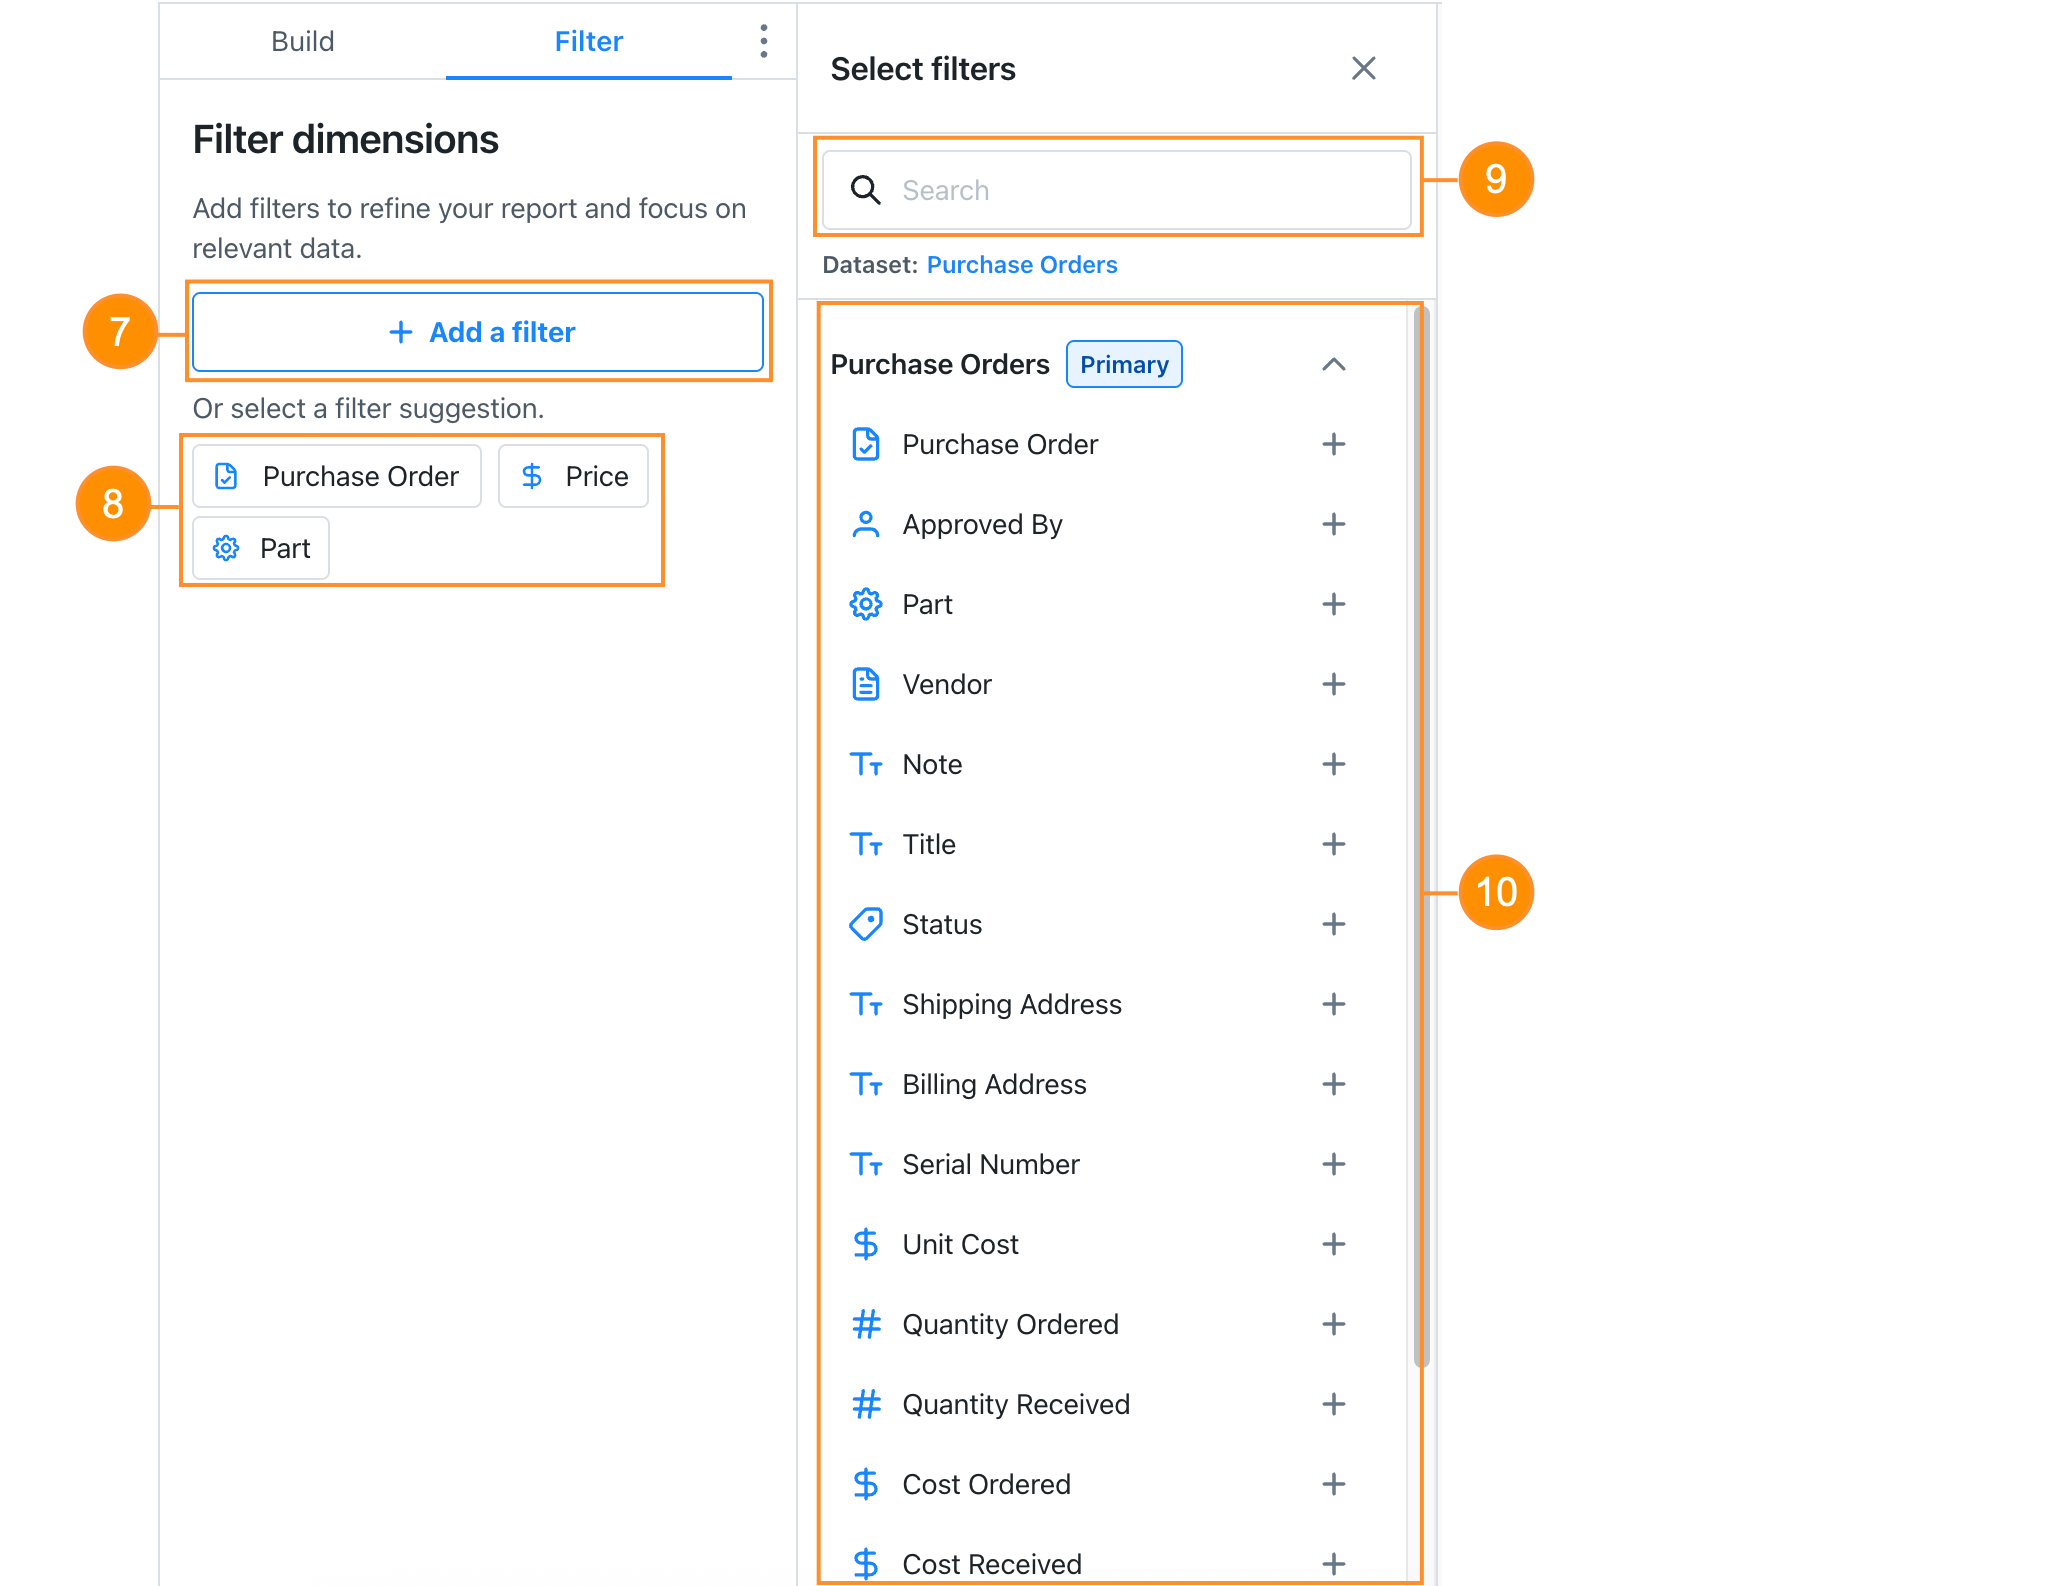
- The Filter tab includes a list of filters you can add to focus on specific data.
| Tab | Description | |
|---|---|---|
| Build | 1 | Option to add columns to the report. The Select columns panel opens when you select this option. |
| 2 | List of all columns available from a selected dataset. Additional columns from linked datasets are also listed. For details, see Datasets. | |
| 3 | Search bar to find a specific column by name. | |
| 4 | List of columns added to the report. In the Data and dimensions section, you can drag the columns to reorder them. | |
| 5 | Option to add formulas to the report. A formula card appears when you select this option. For details, see Add Formulas to a Custom Report. | |
| 6 | Settings to add a visualization to the report. The settings vary depending on the visualization selected. For details, see Visualization Options. | |
| Filter | 7 | Option to add filters to the report. The Select filters panel opens when you select this option. Added filters appear in the Filter dimensions section. |
| 8 | Filter options. | |
| 9 | Search bar to find a specific filter by name. | |
| 10 | List of all filters available for a selected dataset. |
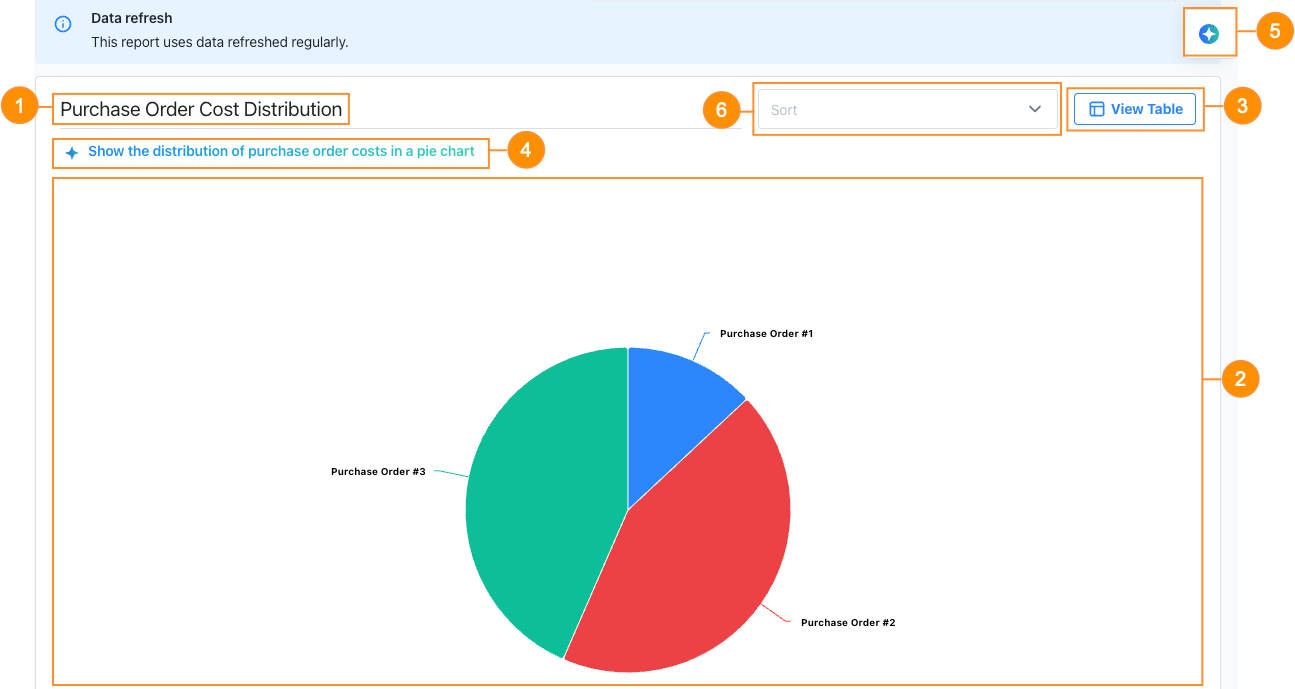
Preview Panel
The preview panel allows you to see your custom report as you build it. With this live view, you can easily adjust the final look of your report.
| Description | |
|---|---|
| 1 | Name of the report. Depending on how you share the report, the name will appear differently:
|
| 2 | Live view of the report as you build it. |
| 3 | Option to access the underlying data of the report in a table format. This option is only available if you select a graph visualization for the report. |
| 4 | Prompt used to generate the report. This option is only available if you generate a custom report with the MaintainX AI engine. For details, see Build a Custom Report with AI. |
| 5 | Option to open the Report Builder AI's reasoning panel. This option is only available if you generate a custom report with the MaintainX AI engine. For details, see Build a Custom Report with AI. |
| 6 | Options to sort:
|
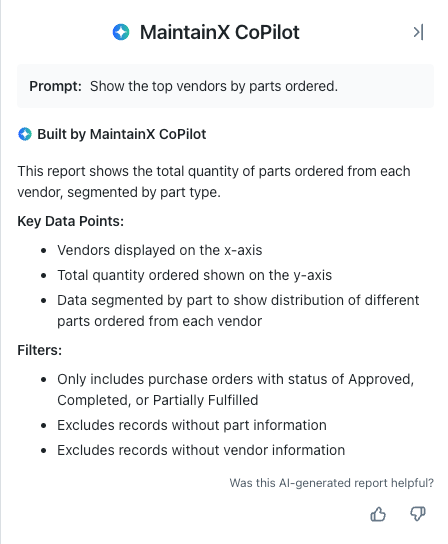
Reasoning Panel
After prompting MaintainX AI to generate a custom report, you can access the reasoning panel. The reasoning panel helps you understand how the AI engine generated a custom report.
Select (AI) to open the panel and review the following information:
- The prompt used.
- The key data points selected to answer the prompt.
- The filters applied to the report to refine the data.
Walkthrough
After reviewing the layout and key components of the Report Builder interface, follow the instructions below to build a custom report.
You can build a custom report in one the following ways:
Regardless of which option you select, the configuration process for the report remains the same. The following instructions are designed to be generic so you can apply them to any report type.
Configure Columns
-
In the builder panel, select the Build tab.
-
Select + Add column. The Select columns panel opens.
-
In the Select columns panel, select the columns you need for your report. The selected columns appear in the Data and dimensions section of the Build tab.
tipYou can also search for a specific column by name and add it to the report.
-
(Optional) Drag the columns to reorder them.
-
(Optional) Select + Add formula to add a formula to your report. For details, see Formulas.
Configure Filters
-
In the builder panel, select the Filter tab.
-
Select + Add a filter. The Select filters panel opens.
-
In the Select filters panel, select the filters you need for your report. The selected filters appear in the Filter dimensions section of the Filter tab.
tipYou can also search for a specific filter by name and add it to the report.
Configure the Visualization
- In the builder panel, select the Build tab.
- In the Visualization section, select a visualization.
- Configure the selected visualization. For details, see Configure a Custom Report's Visualization.
Share a Report
To save and add your report to a custom dashboard:
-
In the preview panel, enter a card name for your report. A card name is mandatory if you want to add a custom report to a custom dashboard.
-
Select Add to Dashboard to either:
- Add the report to an existing custom dashboard.
- Create a new custom dashboard and add the report.
For details, see Create a Custom Dashboard.
To export your report in a file:
-
In the preview panel, enter a card name for your report. A card name is not mandatory but will be added to the export file name.
-
Select Export to either:
- Export to CSV to export the report as a CSV file. If the report includes a visualization, the exported CSV will contain the underlying data in a table format.
- Export to PDF to export the report as a PDF file.
Examples
Report Builder supports an extensive list of use cases for custom reports. Now that you’ve walked through the main steps, here are two examples to get you started.
Each example is fully reproducible.
Purchase Order Costs
Let's say you want to build a pie chart to view the distribution of purchase order costs in your MaintainX organization during the last month.
| Dataset | Dimensions | Filters | Visualization Type |
|---|---|---|---|
| Purchase Orders |
| Completed At: 1 Month | Pie |
Work Orders Lifecycle Duration
Let's say you want to build a table report to get an insight on your work orders' lifecycle duration.
| Dataset | Columns | Formula | Visualization Type |
|---|---|---|---|
| Work Orders |
|
| Table |